Note
Click here to download the full example code
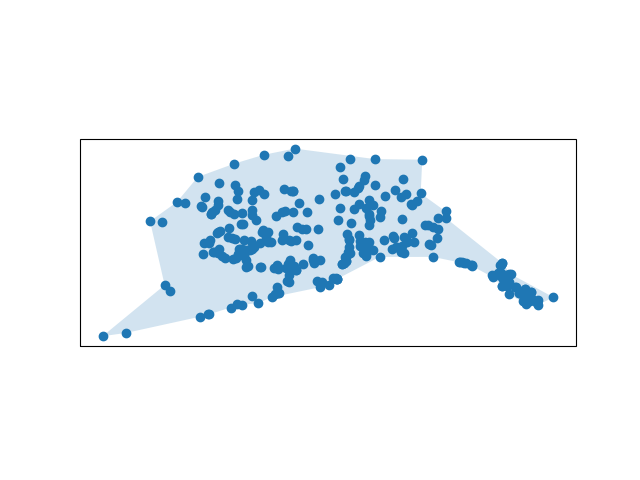
Alpha Shapes with GeoPandas GeoDataFrame
This example opens a shapefile with GeoPandas, and generates a new GeoDataFrame with the alpha shape as its only geometry. It then plots the geodataframe with cartopy.
10 11 12 13 14 15 16 17 18 19 20 21 22 23 24 25 26 27 28 29 30 31 32 33 34 35 36 37 38 39 40 41 42 | import os
import matplotlib.pyplot as plt
import cartopy.crs as ccrs
import geopandas
import alphashape
try:
DATA = os.path.abspath(os.path.join(os.path.dirname(__file__), 'data'))
except NameError:
DATA = os.path.abspath(os.path.join(os.path.dirname(os.getcwd()),
'examples', 'data'))
# Define input points
gdf = geopandas.read_file(os.path.join(DATA, 'Public_Airports_March2018.shp'))
# Generate the alpha shape
alpha_shape = alphashape.alphashape(gdf)
# Initialize plot
ax = plt.axes(projection=ccrs.PlateCarree())
# Plot input points
gdf_proj = gdf.to_crs(ccrs.Robinson().proj4_init)
ax.scatter([p.x for p in gdf_proj['geometry']],
[p.y for p in gdf_proj['geometry']],
transform=ccrs.Robinson())
# Plot alpha shape
ax.add_geometries(
alpha_shape.to_crs(ccrs.Robinson().proj4_init)['geometry'],
crs=ccrs.Robinson(), alpha=.2)
plt.show()
|
Total running time of the script: ( 0 minutes 55.497 seconds)